|
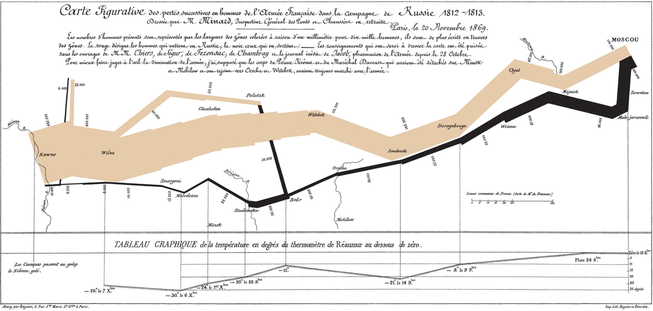
Browsing through the web or attending conferences in the area of IT and marketing, one might get the impression that data science is ubiquitous. If somebody starts researching what data scientists actually do, they mostly come across terms like predictive modelling, machine learning and data mining. These terms sound sophisticated – and the activities they imply certainly are. However, apart from all modelling, algorithms and fancy tools it should not be overlooked what I think is a core task of a data scientist. They have to help people to understand data and support their decision making. To achieve this, data has to be presented in an understandable, “digestible” and convincing manner. This is where the field of data visualization comes into play which is an essential and indispensable aspect of doing data science. Data visualization was invented long before the IT revolution – you could actually say it was not so long after the French revolution. Charles Joseph Minard pioneered the graphical illustration of information in the first half of the 19th century. A lot of his work is still inspiring today. In 1869, when he was already retired, Minard produced a chart that many regard as one of the best data visualizations ever made. On the very left, it shows Napoleon Bonaparte’s Grande Armée at the start of the 1812 Russia campaign. The thickness of the line represents the size of the army. In addition to the size of the army, the visualization incorporates the distance travelled by the soldiers, the temperature, direction of travel, latitude and longitude and the relative location. That is tons of information integrated in one beautiful and graspable visualization!
0 Comments
Leave a Reply. |
Categories
All
Archive
June 2024
|
