Have you heard about Giving Tuesday? Giving Tuesday is the equivalent to Black Friday and Cyber Monday – but for charitable donations. It was started in 2012 during the American Christmas and holiday season. Thanksgiving is traditionally the fourth Thursday in November, so Giving Tuesday is four days after, i.e. in late November or early December. This year, Giving Tuesday was November 27th, 2018. Having started some years ago, not only the amount of funds collected in the US has continuously risen but also the popularity and perceived relevance of Giving Tuesday for fundraising organizations all over the world. So, is Giving Tuesday a global movement already? We decided to investigate this by analysing Twitter data using the statistical software R.
Obtaining data from Twitter To scrape data from Twitter, one has to apply for a Twitter developer account since July 2018 and create a Twitter app which has to be approved by the platform. You of course also need a Twitter account for that. We went through this quite simple process in which certain information on one’s plans have to be provided. We used the package rtweet to set up the connection from R to Twitter. After having successfully registered a Twitter app, it is recommendable to embed the necessary credentials (Consumer Key, Consumer Secret, Access Token, Access Secret) in the code. After having established the connection, we used the command search_tweets to obtain the tweet data about Giving Tuesday. We started with a search number of 100.000 tweets without retweets. Due to restrictions of the Twitter programming interface (API), setting the parameter retryonratelimit to TRUE allowed for re-connects and stepwise data download.
Code Snippet 1: Get rtweet package, connect to API and obtain data
Analysis
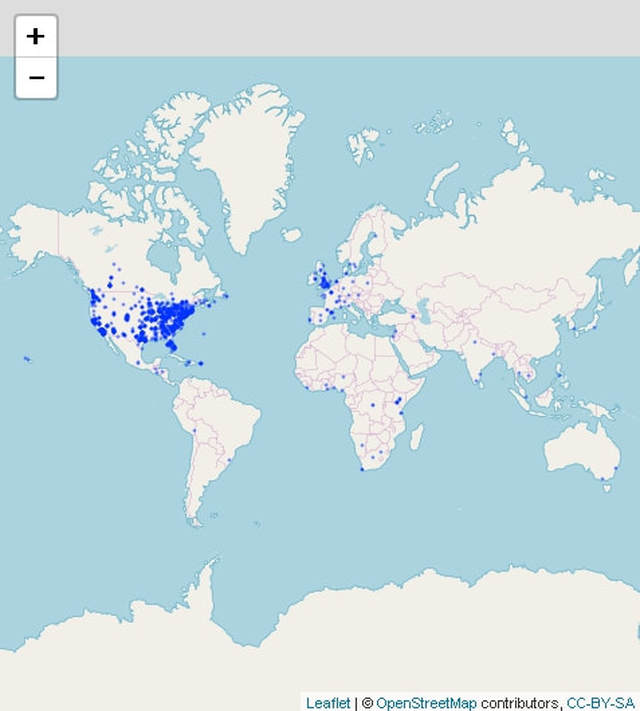
We ended up with 53.653 records in the data frame rt. As the R package in combination with the Twitter API allows the data extraction of the last 6 to 9 days, our data pretty much reflects the Twitter activities regarding Giving Tuesday 2018. Drawing upon our initial question, we now turned to researching how “international” Giving Tuesday has become. The package rtweet allows the extraction of longitude and latitude data for the respective tweets. This then enabled us to draw a world map of tweets. A warning message told us that no such data could be obtained for 51.000 of the 53.000 tweet records. Regardless of that and assuming that the 2.000 tweets for which we got the data are somewhat representative, we used the package leaflet for a plot. It is visible, that tweeting about Giving Tuesday predominantly happens in the US and the UK.
Code Snippet 2: Map
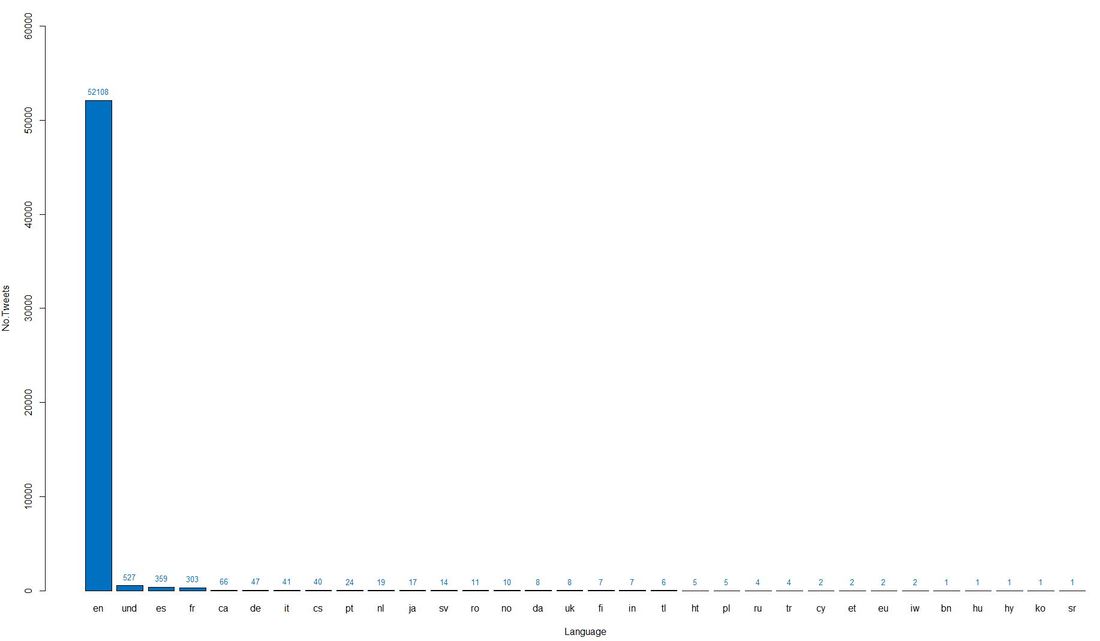
In contrast to scarce geographical information, language information was mostly complete for the tweet data and therefore allows us to the analyse the international relevance of Giving Tuesday even better. The vast majority of tweets is English. Apart from some 500 tweets with undefined language, French and Spanish are the runners-up.
Code Snippet 3: Barplot languages
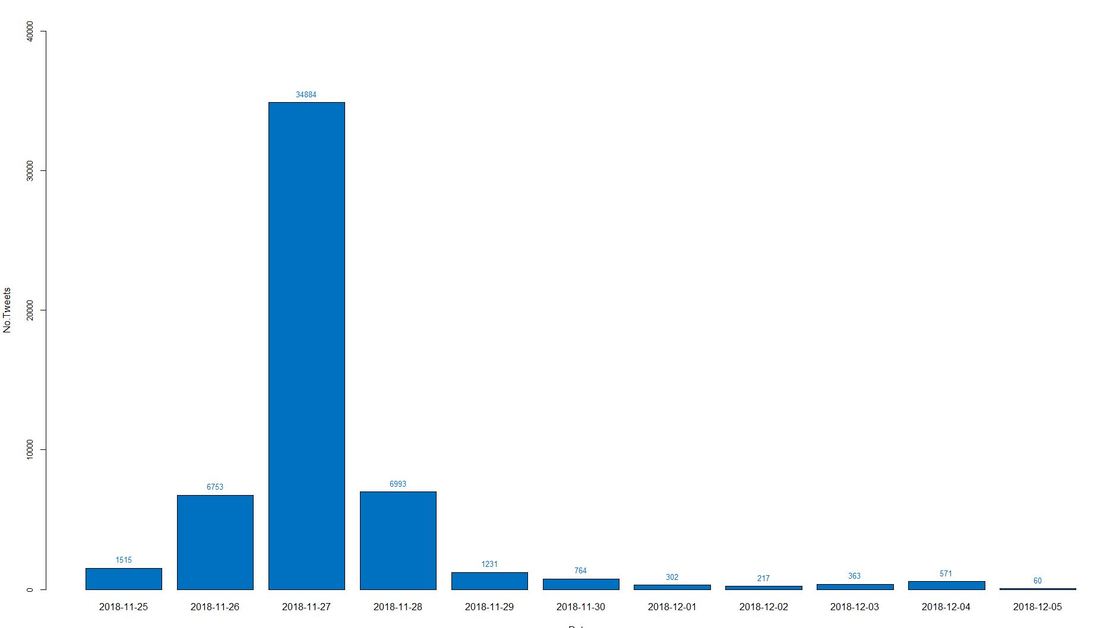
What about the timing of the tweets? We extracted the creation dates of the tweets and visualize them in a barplot. Non surprisingly, the 27th of November, i.e. Giving Tuesday itself shows by far the highest number of tweets. There is also notable activity the day before and after with some 6.000 tweets.
Code Snippet 4: Barplot Dates
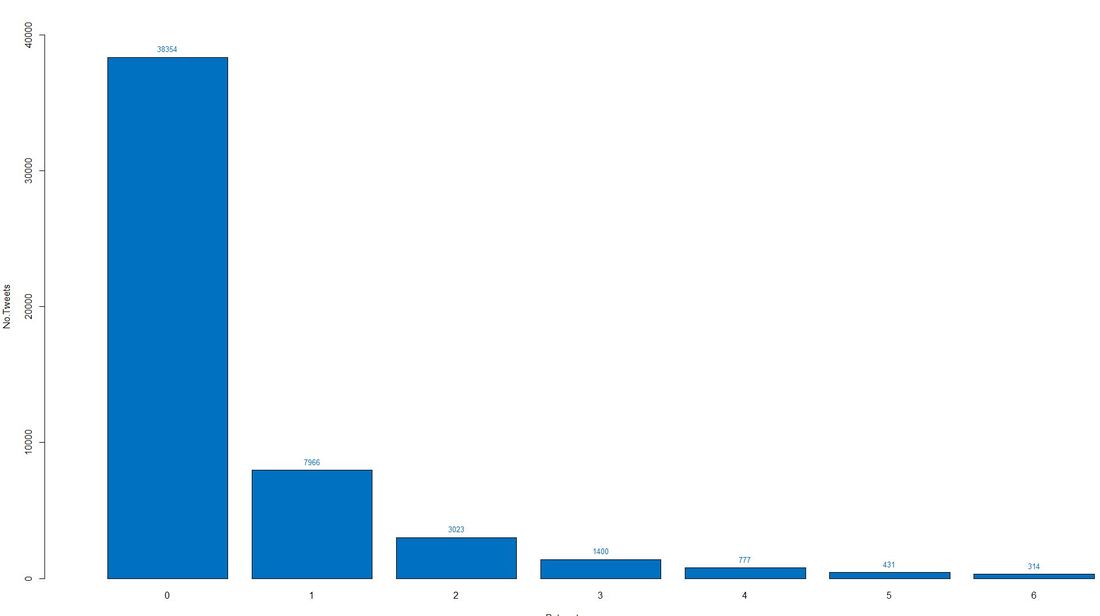
In order to analyse the virality of the Giving Tuesday tweets, we measured and plotted the number of retweets. Our plot below shows that some 38.000 tweets did not get retweeted at all, some 8.000 received 1 retweet and so on (up to 6 retweets).
Code Snippet 5: Barplot Retweets
We then extracted and ordered the respective data to find out which one was the most viral tweet in the dataset. It is by Fred Guttenberg, an American activist against gun violence. His 14-year-old daughter Jaime Guttenberg was killed in the Stoneman Douglas High School shooting on February 14, 2018. This is his tweet:
Our example shows on the one hand that social media analyses can be conducted relatively easily, on the other hand we saw that Giving Tuesday is about to become a truly global phenomenon. So prepare for Giving Tuesday 2019 which might fit well into your Christmas fundraising. Speaking of Christmas: On behalf of joint systems I wish our dear readers a very merry Christmas 2018 and a good start into a successful, healthy and happy 2019 - read you there! :-)
2 Comments
 This month’s blog post illustrates how to extract, analyze and visualize data from Facebook using the software R. We use Rfacebook, a specific package for social media mining. To get started, you have to set up a developer account on www.developers.facebook.com which is really simple given that you have an existing Facebook account yourself. After that there are some steps to follow to connect R to the programming interface (API) of Facebook and make the authentication process reproducible in your R code. There are lots of walk through descriptions available on the web, the one on listendata.com and thinktostart.com helped us a lot to prepare this post. Getting connected and exploring data In order to provide a possibly interesting example for analytical practice, we take a closer look at the Facebook pages of the renowned international charities Unicef and Save the Children. After having connected to the Facebook API via R, we scrape the 100 last posts published on the Unicef page: Code Snippet 1: Scrape data from Facebook page
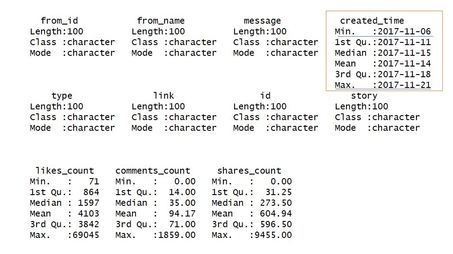
The command getPage() creates a data frame which we can use for further analysis. It contains the following variables:
We take a look at the mentioned data frame using summary(), re-format the column created_time into a date and run the descriptive statistics again: Code Snippet 2: Look at data frame and re-format created_time
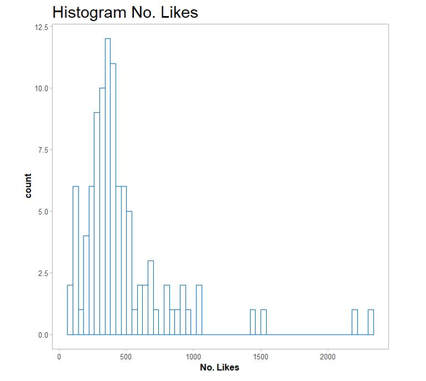
Using the summary() command we see that the last 100 posts were published in a period of almost 2 weeks between November 6th and November 21st 2017 (minimum and maximum of created_time). So-called likes and shares on Facebook are indicators that reflect the reception and virality of posted content. Content might come in the form of photos, videos or posted links. Let us start with a simple histogram of like counts for recent posts on the page under scrutiny. We therefore embed the data frame unicef in a command within the popular visualization package ggplot2: Code Snippet 3: Histogram of Likes for last 100 posts
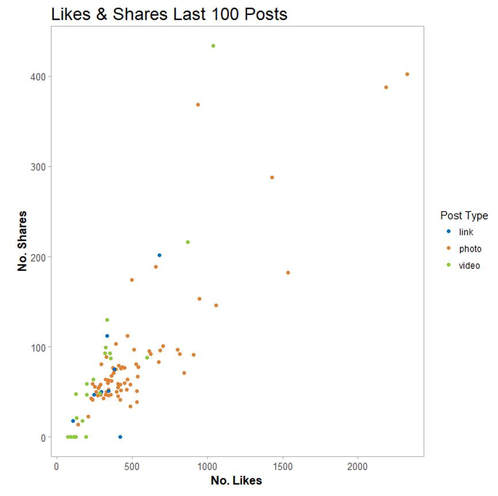
This is the plot we end up with: As we are curious what type of content posted reached a significant number of likes and shares on our example page, we use at data frame unicef and create a scatterplot of the last 100 likes and shares. This is how the respective code looks: Code Snippet 4: Plot Likes and Shares for last 100 Posts
We see the two recent posts with the highest numbers of likes and share were both using photos (see two orange points in the upper right corner in the plot below). Text Mining In order to dive deeper in to content-related analyses of social media, we apply some basics of text mining using several packages combined. Text mining is wide a field with a large number of applications in different areas. One of our future blog posts will try to dig deeper and provide background information in this regard. For the sake of brevity and because of the focus on the Facebook API, we focus on the basics this time. Word clouds which are also called tag clouds are commonly used to visualize text data. Typically a conglomerate of words from the text under scrutiny is visualized using word sizes in relation to the frequency of appearance in the respective text. Word clouds can be created in R with relative ease using the package wordcloud but require some preparatory steps for data extraction and preparation. For this purpose we use the packages tm for text mining and SnowballC for text stemming. Our code is inspired by Alboukadel Kassambara’s blog post on text mining basics. To illustrate the use of text mining in social media analyses, we take a closer look at the text data within the last 100 posts from the international charities Unicef and Save the Children. The subsequent steps needed can be summarized as follows:
This is how those steps look in R language: Code Snippet 5: Text Mining and Word Cloud Creation
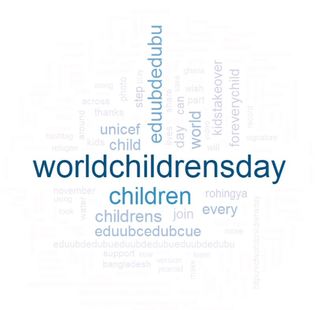
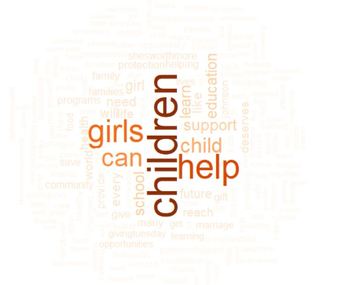
The generated word cloud for the scraped most recent Facebook posts of Unicef looks as follows: It is not too surprising the term world children's day is so prominently positioned in the word cloud of recent posts by Unicef. November 20th is United Nations Universal Children’s Day, it is the date when the UN adopted the Decleration of the Rights of the Child (1959) as well as the Convention of the Rights of the Child. For the sake of comparison, we re-run the code for data extraction, data processing and visualization again and generate a word cloud for the last 100 posts of Save the Children: !Whereas Unicef obviously related to the World Children Day within their Facebook communication which might be related to their strong ties to the United Nations, Save the Children literally kept on putting the terms children and child in the center of their content.
Conclusion There are numerous social media analytics tool around (both free and paid, see for example this blog post for a quick overview) around. However, using the Facebook API with R raises the possibility of using the power and flexiblity of R to gain additional insights from accessible Facebook data. Have a nice fall and stay connected (via Facebook or any other mean :-)! |
Categories
All
Archive
June 2024
|
