 Clustering means grouping similar things together. In this month’s we take a closer look at how the so called k-means algorithm as a clustering method might help to develop an even deeper understanding of established donor segments. Many fundraising organizations segment their donor bases to enable target-group oriented communication and appeals. Working with segments also allows the development of more differentiated analyses on group migrations and income development. The example organization whose data we are playing around with has an up-and-running segmentation model that evaluates the payment behaviour of donors in terms of Recency (when was the last payment), Frequency (how often payments are made) and Monetary Value (sum of donations). This RFM method is commonly used in database-related direct marketing, both in the profit and non-profit sector. We take a closer look at the best donor group in the following. The segmentation model already tells us that the group under scrutiny consists of “good donors” in terms of payment behaviour. In this regard, the segment as such can be seen as a homogenous group. Can a clustering algorithm like k-means generate additional insights regarding the “inner structure” of this group? K-means is an unsupervised machine learning algorithm. Unsupervised learning data comes without pre-defined labels, i.e. any kind of classifications or categorizations are not included. The goal of unsupervised learning algorithms is to discover hidden structures in data. The basic idea of k-means is to assign a number of records (n) into a certain number of similar clusters (k). The number of clusters k is either pre-defined or can be jointly defined by the respective analyst / fundraising manager. The following walktrough was inspired by Kimberly Coffey’s blogpost on k-means Clustering for Customer Segmentation. It is a highly recommended read and can be found here. Data extract and preprocessing Our example organization has an established RFM-based segmentation model that yields 4 core groups. We defined the “best” of those groups to be subject for a k-means clustering attempt. The dataset we extract is straightforward in the first place as it contains the unique identifier, the Recency measured as number of days between December 31st, 2017 and the day of the last donation per person. Frequency reflects the number of payments for the respective record in 2017 whereas Monetary Value shows the donation sum. 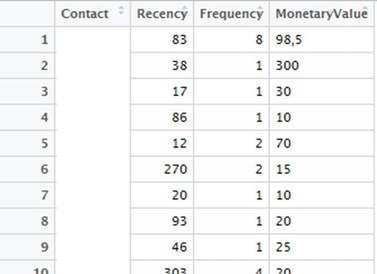 K-means clustering requires continuous variables and it works best with (relatively) normally-distributed, standardized input variables. We therefore apply a logarithm (log) to the variables and standardize them to avoid positive skew. Standardizing variables means re-scaling them to have a mean of zero and a standard deviation of one, i.e. aligning them to the standard normal distribution. The following code snippet illustrates the loading and transformation of the data. Code Snippet 1: Load packages and data, then transfrom data
This is how our dataset looks like the aforementioned transformation. Columns 5 to 7 contain the logs of Recency, Frequency and Monetary Value, whereas the standardized (z-)values are in columns 8 to 10. 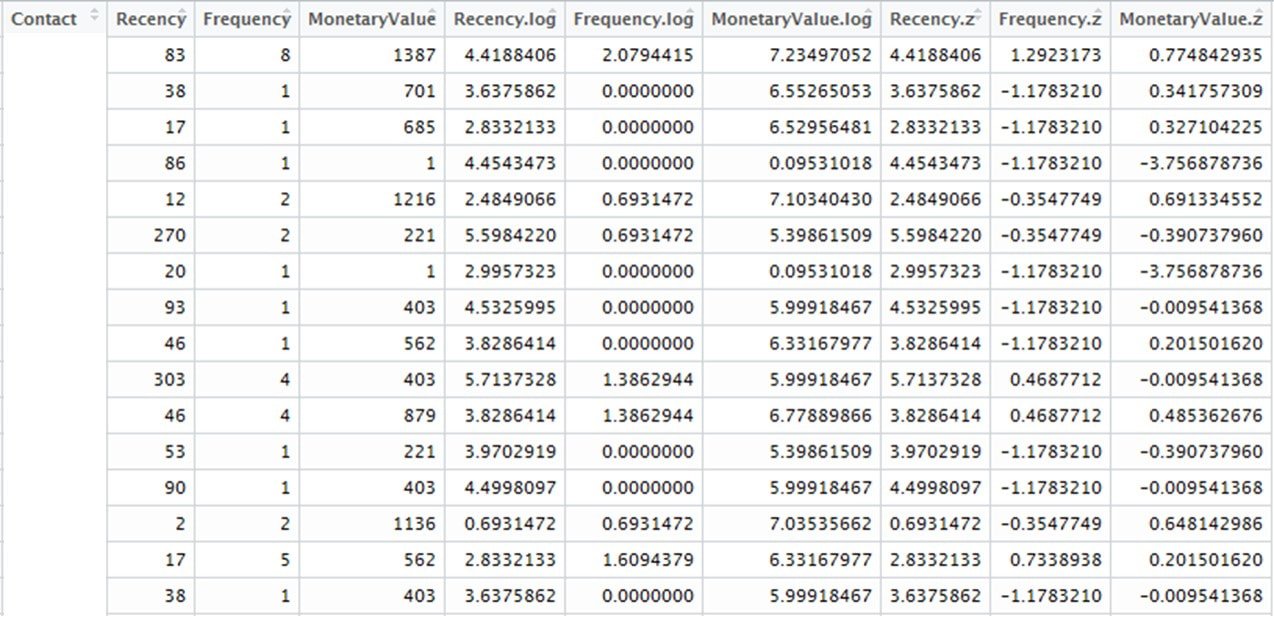 A quick exploratory view To intially dive into the data, we plot the log-transformed Monetary Value as well as log-transformed Frequency of donations and use the log-transformed Recency for colouring by using the code in Code Snippet 2. Code Snippet 2: Exploratory plot of RFM variables
What is striking is the high general density of observations on the one hand (which is due to the large amount of data) and the different shades of blue that reflect certain heterogeneity in terms of Recency. 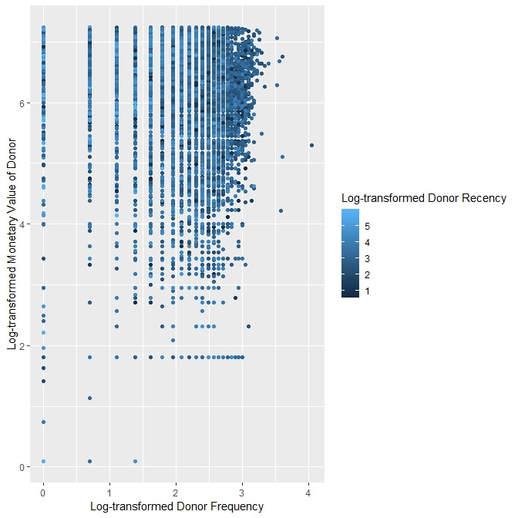 Running the K-means Algorithm We now turn to running the k-means algorithm. The following code contains a loop that runs for a number of j clusters (in this example 10). It writes the cluster membership on donor level back into the dataset, creates two-dimensional plots (see example for 3 and 7 clusters below) and collects the model information. Code Snippet 3: K-means clustering
These are two output examples of the code using 3 and 7 clusters. 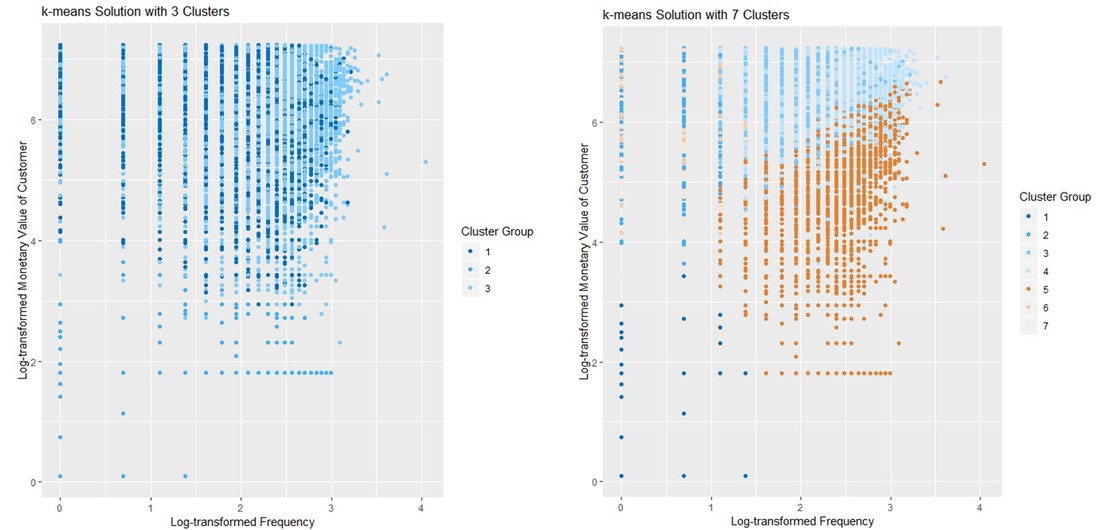 So how do we choose the “optimal” number of clusters now? The graphs below both aim for the detection of the number of clusters beyond which adding a cluster adds only little additional explanatory power. In other words we look for bends in the so-called elbow chart. In our example it looks as if this would be at 4. The same decision could have also been made or at least influenced by a business decision regarding the "feasible" number of clusters. Adding additional clusters always adds explanatory power, however, in practice 4 groups are easier to handle (e.g. in the context of a direct marketing test) than 10 or more clusters. 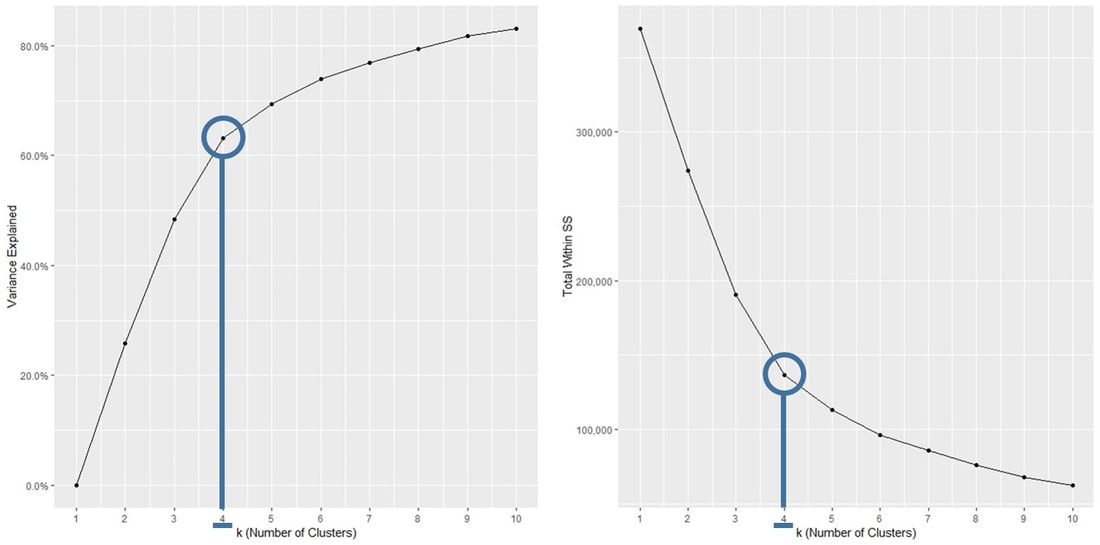 Results and interpretation 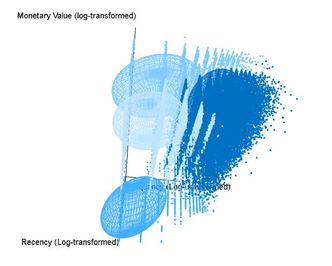 Let us now take a closer look at the results. Clik on the picture on the left to get to an interactive 3d-graph of the 4-cluster solution for which the R-code can be found below. The 4-cluster solution yields 4 ellipsoids aiming to reflect the areas with high observation densities for the clusters. These ellispoids should contribute to the ease of reading the graph, the actual observations are still represented by differently coloured dots just like in the 2-dimensional plot we used for exploration. The three "upper clusters" in the picture share a comparable level of Monetary Value and Recency. The dark blue ellispoid stand out of the three as it reflects higher Frequeny. The lower ellipsoid reflects observations that rank relatively low on all of the three RFM variables (remember, the higher the recency, the "worse" - knowing that we are working with a dataset of good donors). The video below contains a fixed-axis rotation. Code Snippet 4: 3d graph
Conclusion
So, what can we conclude from our clustering attempt? K-means is a widely-used and straightforward algorithm that can be applied relatively easily in practice. It is, however, worthwhile to dive into the underlying concepts of the algorithm and consider the related diagnostics (variance explianed, "withins"). Due to the derived possibilites in terms of data visualization, results can be directly communicated to fundraising decision makers. These decision makers should be involved in the process at an early stage. Although there are "objective" measures for the numbers of clusters, application-oriented considerations (e.g. for further analyses of test designs) should not be left out. We hope you liked this month's post and wish you a nice beginning of autumn. Do not hesitate to share, comment, recommend etc. Read / hear / see you soon!
0 Comments
|