 This month’s blog post illustrates how to extract, analyze and visualize data from Facebook using the software R. We use Rfacebook, a specific package for social media mining. To get started, you have to set up a developer account on www.developers.facebook.com which is really simple given that you have an existing Facebook account yourself. After that there are some steps to follow to connect R to the programming interface (API) of Facebook and make the authentication process reproducible in your R code. There are lots of walk through descriptions available on the web, the one on listendata.com and thinktostart.com helped us a lot to prepare this post. Getting connected and exploring data In order to provide a possibly interesting example for analytical practice, we take a closer look at the Facebook pages of the renowned international charities Unicef and Save the Children. After having connected to the Facebook API via R, we scrape the 100 last posts published on the Unicef page: Code Snippet 1: Scrape data from Facebook page
The command getPage() creates a data frame which we can use for further analysis. It contains the following variables:
We take a look at the mentioned data frame using summary(), re-format the column created_time into a date and run the descriptive statistics again: Code Snippet 2: Look at data frame and re-format created_time
Using the summary() command we see that the last 100 posts were published in a period of almost 2 weeks between November 6th and November 21st 2017 (minimum and maximum of created_time). 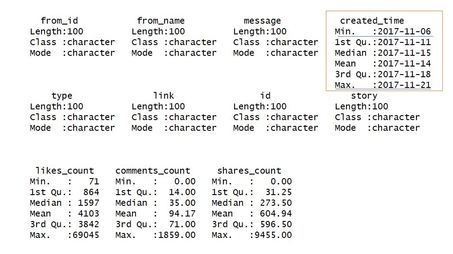 So-called likes and shares on Facebook are indicators that reflect the reception and virality of posted content. Content might come in the form of photos, videos or posted links. Let us start with a simple histogram of like counts for recent posts on the page under scrutiny. We therefore embed the data frame unicef in a command within the popular visualization package ggplot2: Code Snippet 3: Histogram of Likes for last 100 posts
This is the plot we end up with: 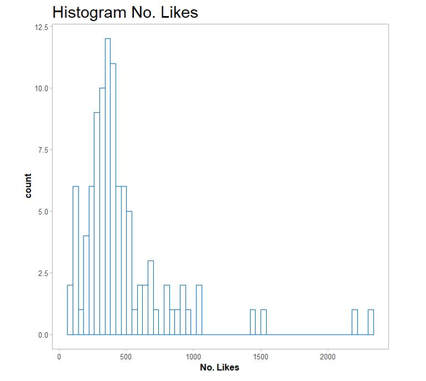 As we are curious what type of content posted reached a significant number of likes and shares on our example page, we use at data frame unicef and create a scatterplot of the last 100 likes and shares. This is how the respective code looks: Code Snippet 4: Plot Likes and Shares for last 100 Posts
We see the two recent posts with the highest numbers of likes and share were both using photos (see two orange points in the upper right corner in the plot below). 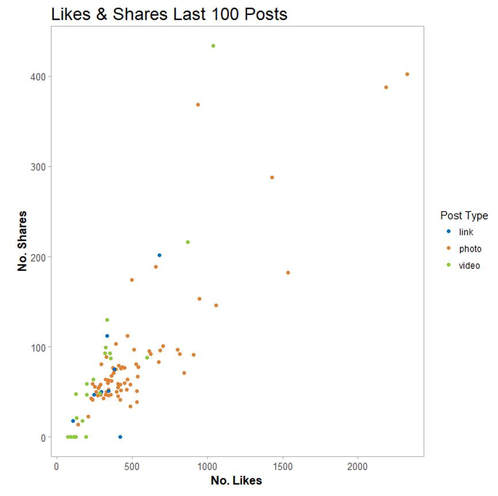 Text Mining In order to dive deeper in to content-related analyses of social media, we apply some basics of text mining using several packages combined. Text mining is wide a field with a large number of applications in different areas. One of our future blog posts will try to dig deeper and provide background information in this regard. For the sake of brevity and because of the focus on the Facebook API, we focus on the basics this time. Word clouds which are also called tag clouds are commonly used to visualize text data. Typically a conglomerate of words from the text under scrutiny is visualized using word sizes in relation to the frequency of appearance in the respective text. Word clouds can be created in R with relative ease using the package wordcloud but require some preparatory steps for data extraction and preparation. For this purpose we use the packages tm for text mining and SnowballC for text stemming. Our code is inspired by Alboukadel Kassambara’s blog post on text mining basics. To illustrate the use of text mining in social media analyses, we take a closer look at the text data within the last 100 posts from the international charities Unicef and Save the Children. The subsequent steps needed can be summarized as follows:
This is how those steps look in R language: Code Snippet 5: Text Mining and Word Cloud Creation
The generated word cloud for the scraped most recent Facebook posts of Unicef looks as follows: 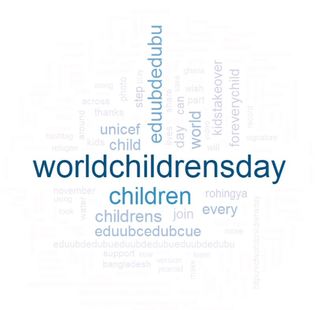 It is not too surprising the term world children's day is so prominently positioned in the word cloud of recent posts by Unicef. November 20th is United Nations Universal Children’s Day, it is the date when the UN adopted the Decleration of the Rights of the Child (1959) as well as the Convention of the Rights of the Child. For the sake of comparison, we re-run the code for data extraction, data processing and visualization again and generate a word cloud for the last 100 posts of Save the Children: 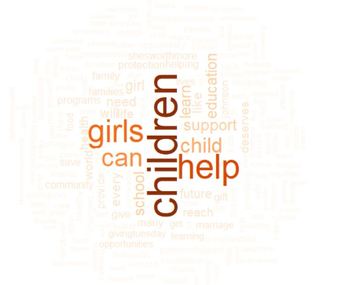 !Whereas Unicef obviously related to the World Children Day within their Facebook communication which might be related to their strong ties to the United Nations, Save the Children literally kept on putting the terms children and child in the center of their content.
Conclusion There are numerous social media analytics tool around (both free and paid, see for example this blog post for a quick overview) around. However, using the Facebook API with R raises the possibility of using the power and flexiblity of R to gain additional insights from accessible Facebook data. Have a nice fall and stay connected (via Facebook or any other mean :-)!
1 Comment
|