 In last month's blogpost, we referred to the impactful Economist article stating that data is the new oil. One interpretation of this metaphor is that data can be seen as "fuel" for today's economy. This also applies to the nonprofit sector. The reference to oil does, however, not necessarily mean "digging for data" implies high costs in terms of acquiring and collecting it. There is quite some open data around which might be useful in a fundraising context. We see a broad range of possible use cases when it comes to open data in a fundraising context:
We will rush trough two hands-on examples to illistrate how to obtain, process and visualize open data with possible value for fundraising decision makers and analysts. Example 1: Visualizing income data on regional level Geographical disparities can be of relevance in the context of certain fundraising practices such as events or contact to High Net Worth Individuals (HNWI). Some regions are "wealthier" than others in terms of the respective average income levels. This information allows some conclusions about overall fundraising potential in a respective area. An aggregation level that we find useful and a good "common denominator" are the so-called NUTS regions the European Union uses. NUTS sounds like an English acronym, however, it is a French abbreviation and for Nomenclature des unités territoriales statistiques, in other words regional stat units. The European Union´s Statistics Office is called Eurostat. They offer a huge database that can be accessed online and is free of charge in most cases. We download not only data on the regional distribution on the level of NUTS2 areas but also use the specific R package eurostat. NUTS2 areas are quite "intuitive" in our eyes. In Austria, for instance, they reflect the federal provinces whereas Germany with its 16 provinces is split into 38 regions. For reasons of completeness, we show you how we searched for respective income data in the code snippet below. Our code is by the way inspired by this recommendable tutorial on eurostat. Code Snippet 1.1: Load libraries and search for data
The query above shows us 3 tables that contain income data. We decided to use the table with the index tgs00026, it contains data on disposable household income on regional level. Code Snippet 1.2: Obtain both income and geospatial data
We now have two dataframes, one for the income data with a regional variable and one for the actual geospatial data. We merge the two and dive into the visualization immediately: Code Snippet 1.3: Merge datasets into one and visualize data
As we already used a little French today, we are now able already to say voilà as the overview visualization we were striving for is finised and presentable: 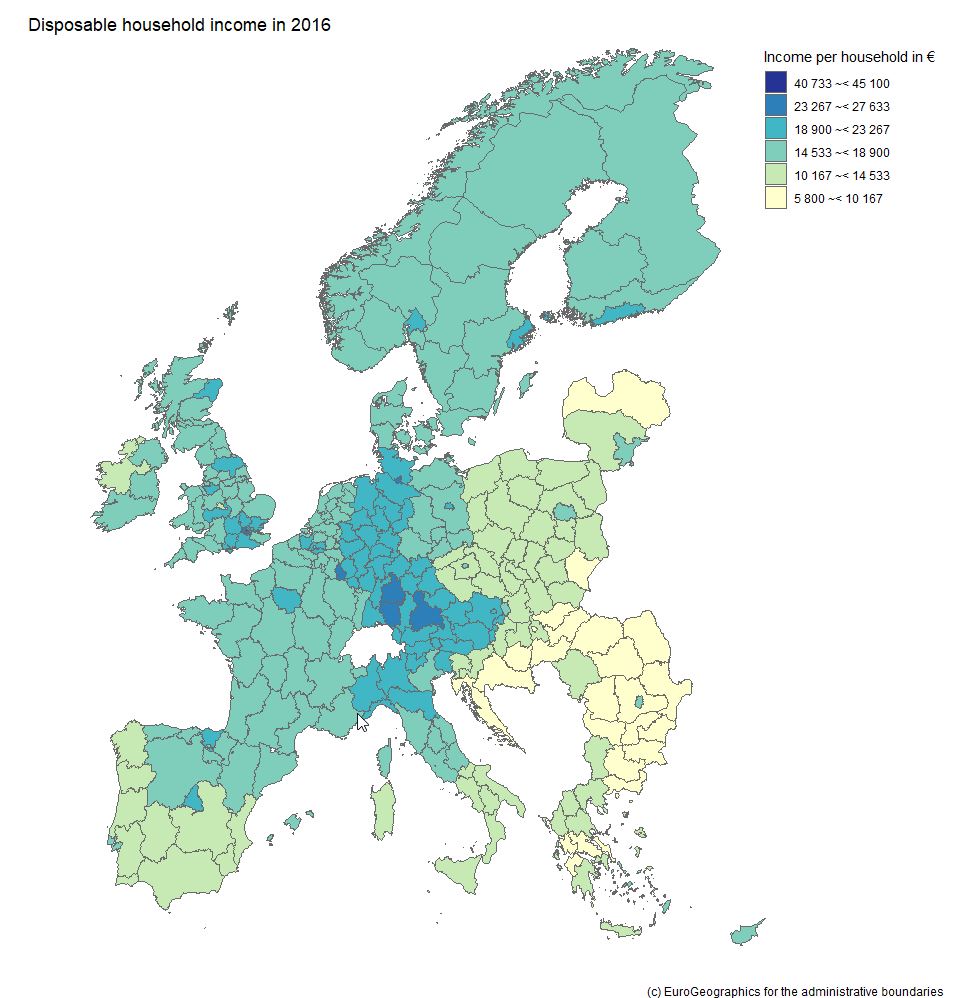 Example 2: What about large companies and their CEOs? The name Forbes might ring a bell if you think of listing the wealthiest people on the planet. Forbes also publishes data on the largest companies on an annual basis. We signed up at the platform data world - which we can also recommend - and obtained the 2018 dataset for the 2.000 largest corporations (here - signup is necessary). Luckily this data contains country information and also names the respective CEO - but step by step. As we are working with a flatfile, we did some data prep in it before loading it into R; we end up with a dataset that contains the following variables:
Code Snippet 2.1.: Read the file and select one country
So far, so good. We now have a condensed dataframe in R that contains the Dutch corporations that are listed in the Forbes 2000, i.e. 22 firms. We prepare a bubble chart with the company revenues and profits on the axes. The market value (mostly in shares) shall be reflected by the acutal size of the bubble. Code Snippet 2.2.: Draw the bubble chart
This is our result: 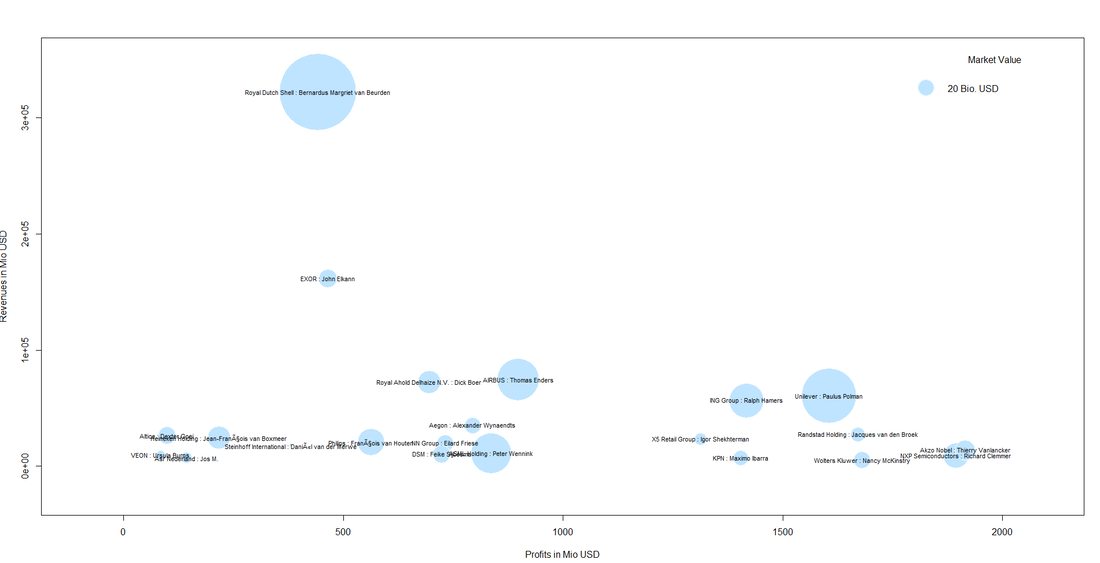
We can also spot a cluster of companies with high profit volumes in the lower right of the bubble chart. This cluster contains "big names" like Unilver but also contains firms that are not as widely known: 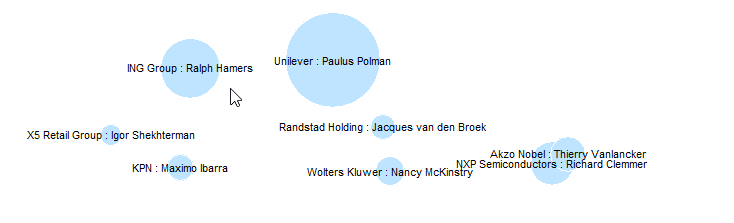 Even though it might not be so easy to meet some of the CEOs immediately, it might be worthwhile researching whether those big and powerful corporations have CSR departments, foundations etc. one can get in touch with. This was it for this month´s post. We hope you stay "open" over the summer break not only towards data but also our blog :-). 
0 Comments
 It was in 2017 when the renowned magazine The Economist wrote: "The world’s most valuable resource is no longer oil, but data." We set up our blog askyourdata.co in the same year. The topics of our articles vary from illustrative applications of models to fundraising data, discussions of topics like Artificial Intelligence for Fundraising to data visualization. The common denominator for our content is the context of charitable non-profit organizations. We think that the tools and methods of advanced analytics and data science can contribute to the effectiveness and efficiency of fundraising organizations. This is why we started wondering whether there are empirical findings on the state of data science and advanced analytics in data science. Good news: We found results that are both recent and interesting. Data Science starts with data. Back in 2016, the American software company EveryAction surveyed some 460 professionals (presumably mainly in the US; the complete study can be downloaded here) from non-profits about their habits, culture, and outlook on the state of data at their organizations. Some key findings:
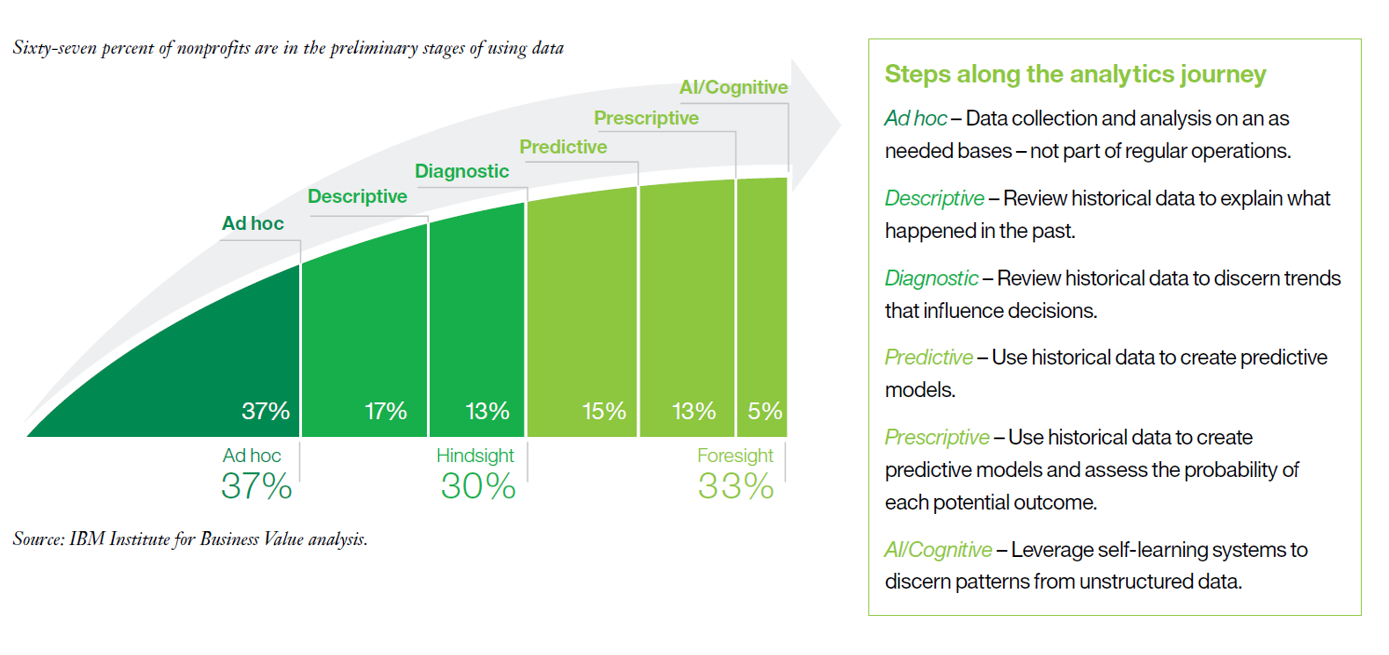 A bit more than two-thirds of the respondents conduct ad hoc or (ex post) hindsight analysis (descriptive, diagnostic) whereas the remaining third has stepped into advanced analytics (predictive, prescriptive, AI / cognitive). Having mentioned the term “advanced”, one should not forget about the speed of developments. What might have been considered “advanced” a few years ago might turn into the "standard level" sooner or later. The probably most interesting insight from the survey is that respondents with more advanced analytics capabilities reported higher effectiveness than others on three important metrics (Improve performance against mission, Achieve operating efficiencies, Improve staff productivity). In other words: Non-profits with deeper data capabilities see stronger impact, transparency and decision making. 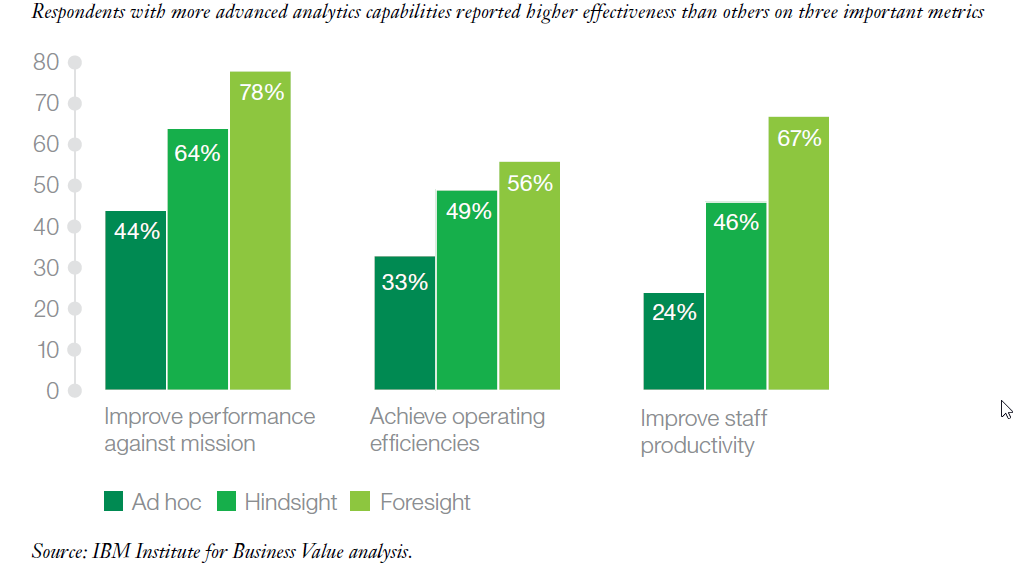 Like the aforementioned study by EveryAction, the IBM survey asked for primary barriers to advancing data and analytics. These are:
What about data science in the non-profit sector? We did not come across specific studies on the state of data science in the non-profit sector in general or fundraising more particularly. However, we had a closer look at the industry segmentations in two major data science surveys. JetBrains polled more than 1.600 people involved in Data Science in the US, Europe, Japan and China (download full study here). One of the questions asked for the industry for which the respondents analyse data. The non-profit sector ranked quite low (5% compared to Accounting / Finance / Insurance and Science with both 16%). This finding can be seen as consistent with the results of the aforementioned studies that diagnose scope for advances in the field of non-profit analytics. The presumably most comprehensive study on the state of data science and machine learning is the annual Machine Learning and Data Science Survey conducted by the platform kaggle.com. Kaggle surveyed almost 24.000 people in October 2018, the results are therefore quite recent. In line with open data thinking, the raw data containing the survey results can be downloaded from the site, there is also a data analysis competition attached to it. The non-profit related results in a nutshell: Of some 24.000 respondents, only a tiny fraction of 0.79% (189 respondents) answered that they work or recently worked for an employer in the non-profit industry. Regardless of the fact that the sample might not be fully representative across industries, this figure shows that data science is still in its beginnings in so-called third sector. 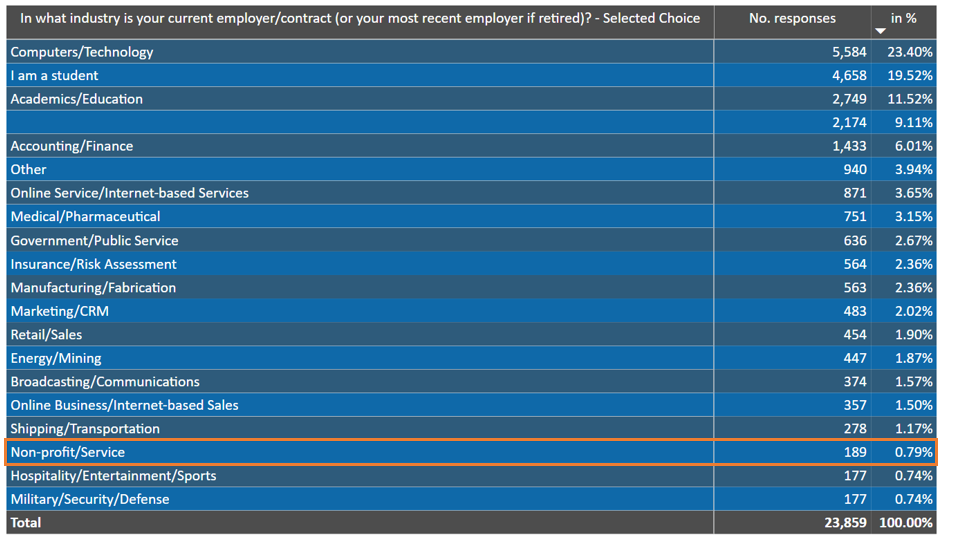 When it comes to the regional distribution of non-profit data scientists, it is striking that a third of respondents that said that they work for nonprofits reside in the United States. India is the runner-up with some 10 percent. The numbers of the remaining countries with respondents is quite evenly distributed. 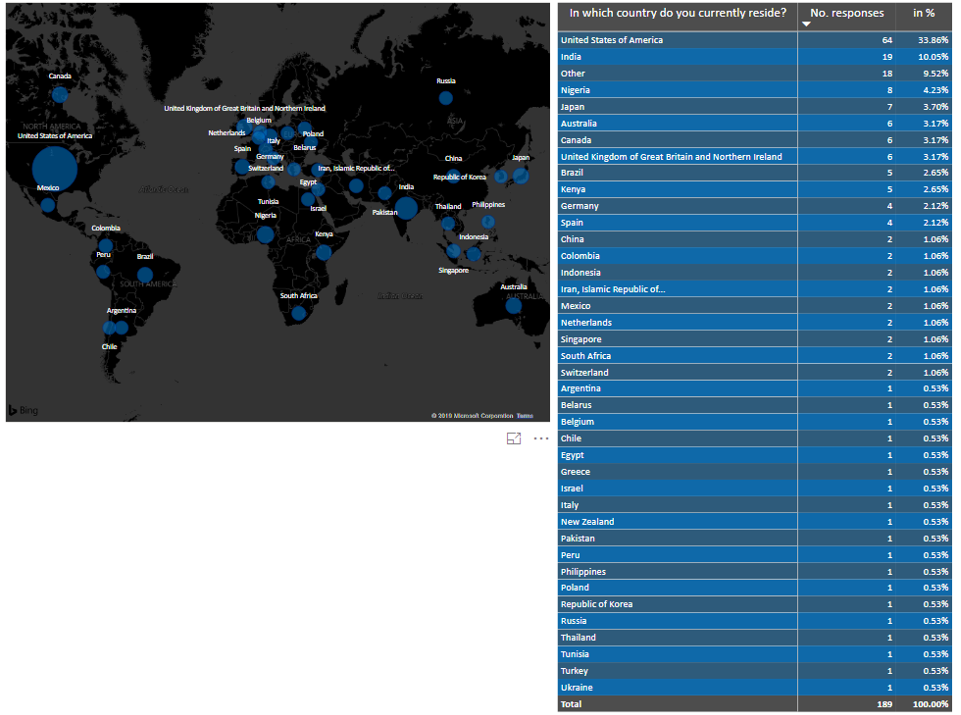 Our conclusion: Non-profit representatives and decision makers are largely aware of the potential benefits that use of advanced analytics and data science might imply for their organizations. Building competencies, structures and systems is often challenged by scarce resources (most prominently budget but also expertise). The answers regarding the presence of data scientists surveyed by JetBrains and Kaggle reflect this state. The good news is: Nonprofits need not feel alone in their advanced analytics endeavours, as outlined by IBM who advocate establishing an insight ecosystem. 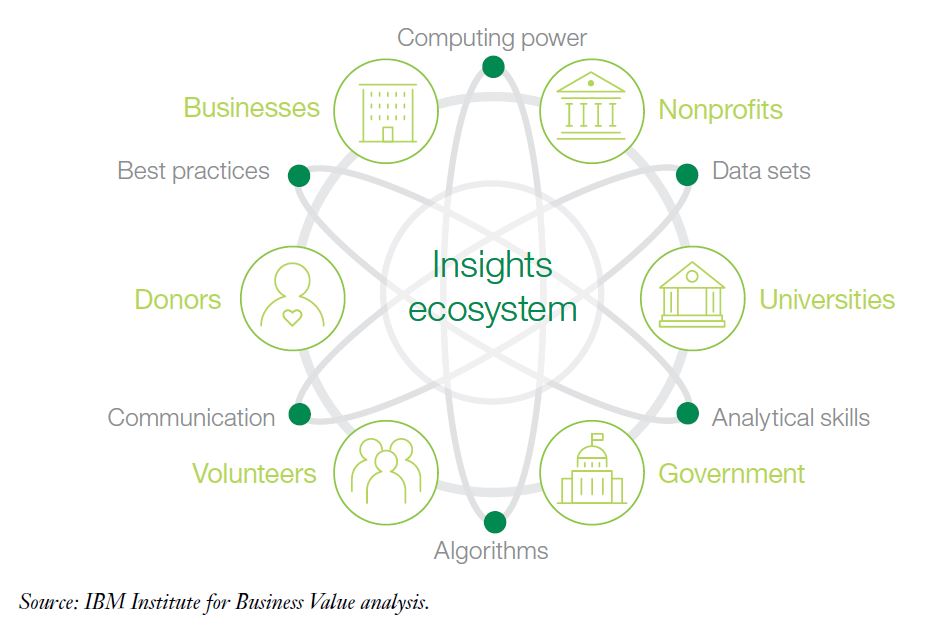 If you are interested in building your own insight ecosystem, you might wish to learn more on what joint systems can offer in this regard.
Let us stay in touch! We wish you a nice rest of spring.  The year 2017 is coming to its close soon. We guess that for many people the days between years are a time to reflect on the opportunities and challenges the year that is about to start will bring. One can expect that this is also true when it comes to trends in Data Science. We did some research for Data Science outlooks 2018. Machine Learning
Machine Learning has been one of the buzzwords in the recent past. We also published an introductory blog post on the topic earlier this year. One might say the term is over-hyped, however, machine learning is applied in academia and across industries as a very recent survey by KDnuggets shows. Dataconomy, a Berlin-based Data Science company, elaborate on the promising field of machine learning but also mention from where organizations are starting from. Regardless of Data Science concepts and tools, 77 percent of German companies still rely on “small" data tools like Excel and Access. Many of them might still have plenty of homework to do to transform into what Dataconomy call data-driven organizations. At the same time, a recent KPMG study (available upon request in German) shows that 60 percent of companies have been able to benefit in different forms (reduction of costs or risks and/or increase of revenues) from Data Science – which of course includes Machine Learning and Artifical Intelligence. Artificial Intelligence (AI) Speaking of artificial intelligence - for many, 2018 will be the year when AI breaks though. The prominent research company Gartner defines AI as one of the most important strategic technology trends for 2018. They refer to a recent survey showing that 6 out of 10 organizations are in the process of evaluating AI strategies whereas the remaining 4 have started adopting respective technologies The analytics company absolutedata goes as far as to speak of AI powered marketing and formulates certain predictions regarding what 2018 will bring in this context:
Bill Vorhies, Editorial Director for Data Science Central, is a bit more hesitant in the context of AI. He predicts that – regardless of the hype – the diffusion of techniques and tools in from the field of AI and deep learning will be slower and more gradual than expected by many. One already visible manifestation of the spread of AI are chat bots which are increasingly used in a web and mobile context. Chat bots essentially process natural language and thereby involve customers and prospects in an interaction. The implementation of facial and gesture recognition currently look like the next big thing as possible applications on the point of sale seem vast. How should nonprofits deal with AI? Steve MacLaughlin, author and Vice President of Data & Analytics at Blackbaud, underlines the vast opportunities for nonprofits but also relativizes the buzz around AI. MacLaughlin explains that AI for nonrpfits requires the availability of the right data, contextual expertise, and continuous learning. Given these factors, AI can support nonprofits to be impactful particularly through fundraising. Big Data We also dealt with Big Data – probably the buzziest of all buzzwords from the field – in February this year. We quite liked a recent blog post by KDnuggets that starts as follows: There's no denying that the therm Big Data is no longer what it used to be [..] note that the t. We now all just assume and understand that our everyday data is huge. There is, however, still value in treating Big Data as an entity or a concept which needs to be properly managed, an entity which is distinct from much smaller repositories of data in all sorts of ways. What follows next is the gist of interviews with various experts from the field talking about their expectations for 2018 and beyond – a really recommendable holiday read. Data Protection The EU General Data Protection Regulation (GDPR) will be enforced from May 25th, 2018. It is yet to be seen to what extent customers and donors will, for instance, actively insist on the Right to be Forgotten – which might have implications for the availability of donor data for advanced modelling as well. People Needed! More and more organizations seem to develop an interest in Big Data experts, Data Architects, Data Scientists etc.. Without any doubt, advanced analytics and Data Science efforts need motivated and skilled women and men to succeed. Florian Teschner conducted an analysis on Data Science job offers recently. Although there is scope for absolute growth in available positions, there is some five fold increase since 2015. Stay tuned to Data Science in 2018 We think it will be worthwhile to keep one’s eyes open in 2018. If you are interested in Data Science as well as the conceptual and technological developments in the field and you are not on Twitter yet, following some influential thinkers from the area might be an interesting starting point. Maptive.com provides a list of potential influencers. If you want to dive a little deeper, some experts’ Github accounts might be a place to go if you look for papers, code etc. - just follow the overview provided by analyticsvidya.com. Last, not least ... ... we wish you and your dear one a happy and relaxed (data-free) Christmas and good start in a successful and dynamic 2018. See you next year on this blog!  Media confront us with bad news every day. In the face of political uncertainties and extremism, climate change, growing inequalities etc. it sometimes seems hard not to see the world as a rather hopeless place. However, we must not forget that - with regard to many aspects of human life such as health, education, life expectancy etc. - we actually live in the best world and time since the beginning of mankind. The good news is: There are tons of data that support this view of the world! There are some guys and pages I can really recommend in this context.
If you are on TED and watch talks there, then you might know Hans Rosling as an inspiring and humorous speaker. Hans is one of the founders of the Gapminder Foundation (www.gapminder.org/). The foundation's page offers great data visualization tools and contains a large number of datasets that can be downloaded for free. Oxford economist Max Roser (www.maxroser.com/), by the way an alumnus of Innsbruck University like myself, is the mastermind behind the platform Our World in Data (https://ourworldindata.org/) which also offers a lot of material and functionalities that can be used to develop and sustain a fact-based world view. |