|
Today I want to introduce 3 different kinds of charts and how they can be applied to data on donor segments and income. You might have come across these kinds of visualizations before - but maybe in different contexts such as the illustration of voter streams after elections or the visualization of genome data. All charts were generated with the software R which is an open source statistical software. I would go as far as to term it ecosystem as there is a vast amount of additional packages and a large community is constantly developing the features of R. The following charts are all interactive html visualization, so please click on the respective pictures below to open them and take a closer look. 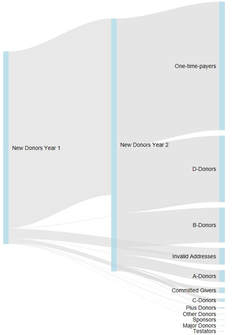 Sankey Diagram Sankey Diagram The first visualization is a so called Sankey Diagram. I have seen them called River Plot as well. Sankey Diagrams are special forms of flow charts. They are named after an Irish captain who first used them in the late 19th century to show the energy efficiency of steam engines. Comparable visualizations are typically used to illustrate detailed election results when it comes to the (calculated) streams of voters from one party to another. If you are a regular reader of this blog, you might have seen a very famous Sankey Diagram by Charles Joseph Minard that illustrates Napoleon Bonaparte's Russia campaign from 1812. The R code used is relatively simple and incorporates the GoogleVis package. An example can be found here (scroll towards the end of the page). The example to the left attempts to visualize the migration of donors from defined segements over time, The thickness of the line represents the number of donors having moved from one group to another. The interactive version of the chart (click the picture) gives you a tooltip showing the exact numbers.  Chord Diagram Chord Diagram The visualization to the right is a so called Chord Diagram. Wikipedia defines Chord Diagrams as a graphical method of displaying the inter-relationships between data in a matrix. Chord Diagrams are quite frequently used to visualize genome data, the New York Times published a beautiful example back in 2007. There are several ways to generate Chord Diagrams in R, I used the tool by Matt Flor that can be found on GitHub. The idea behind the sample data I used is again leant against the migration of donors from segments from year 1 to segments in year 2 within a defined segmentation model. 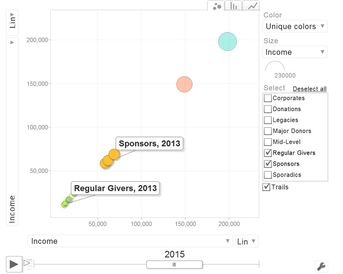 Motion Chart Motion Chart The third chart makes your data move - it is a so called Motion Chart. I used sample data in a flat file containing income per donor segment (or "business area") per year from 2013 to 2016. Again, with some simple lines of code in R using the GoogleVis package, data can be visualized and animated in a bubble chart (with several different options) as well as in more "classical" bar and line charts. It is worth mentioning that no actual data is transmitted to Google when using the API, the actual rendering happens in the browser. The examples I created worked fine in Internet Explorer 11 and Edge under Windows 10. If you are interested in the R code / sample data I used or a chat, please feel encouraged to get back to me via this site, email of social media. I hope you have / had a nice end of summer. See you next month :-)!
1 Comment
|