|
Data is becoming more and more pervasive across industries. Analytics has come quite some way in recent years. A growing number of organizations have implemented analytics solutions and started exploring the potential of data science. With continuing technological advances and accelerating digitization, it is not always easy to overview the current developments in advanced analytics and data science. This end-of-year post tries to provide readers with information in a nutshell on contemporary issues in analytics and data science from a nonprofit and fundraising standpoint. The infographic below is a "one-pager" for decision makers, analysts, data scientists and anyone interested. We differentiate between the topics that seem to be here to stay and relevant trends that should definitely be considered. In addition, we drop some hyped buzzwords that might be topics for the future and are worth observing. Please feel free to download, share, comment etc.  It has been a challenging but also inspirational year for many of us. We wish you and your dear ones a happy and peaceful Christmas 2021 and a good start in a successful, healthy and happy 2022. These are our Christmas wishes in dozens of languages 🎄! All the best and see you in 2022!
0 Comments
Algorithms Everywhere! The effects of the COVID-19 pandemic acted as an accelerator for digitalization in terms of processes, services, or whole business models. Digital technologies are transforming the economy and are becoming ubiquitous. An increasingly widespread application of algorithms is decision-making in businesses, governments, or society as a whole. Algorithms might, for instance, determine who is recruited and promoted, who is provided a loan or housing, who is offered insurance, or even which patients are seen by doctors. Algorithms have become important actors in organizational decision making, i.e. a field that has traditionally been exclusive to humans. As these decisions often have an ethical dimension, the delegation of roles and responsibilities within these decisions deserves scrutiny. This is where Coporate Responsibility comes into play ... Luckily, as social nonprofit organizations work in the interest of the common good in one way or the other way, Corporate Responsibilty tends to be rooted in the "DNA" of nonprofits. At the same time, algorithms have also made their way into the sector of fundraising nonprofit organization as we had already highlighted in specific a blogpost from 2019. Compared to other contexts such as human resource management or the labour market (see for example this critical discussion of the algorithm used at the Austrian Labour Market agency "AMS"), the consequences of algorothmic decision making in the context of fundraising nonprofits will tend to be rather harmless. However, in the light of technological advances and the need for nonprofits acting as as active members of modern society that have a voice, NPO decision makers should be aware of the big picture in terms of "Ethical AI". Implications and Challenges In the course of scrutinizing the ethics of algorithms, not only considering the algorithms themselves but also their actual implementation in software and platforms should be scrutinized. Two groups of concerns can be identified in terms of the ethical challenges implied by algorithms. there are epistemic concerns on the one hand when evidence provided by algorithms is inconclusive, inscrutable, or misguided. On the other hand, there are normative concerns related to unfair outcomes, transformative effects and traceability. These normative concerns have in common that they are related to the actions derived from algorithmic results. In a nutshell, the mentioned concerns can be summarized as follows:  leant against Mittelstadt, B. D., Allo, P., Taddeo, M., Wachter, S., & Floridi, L. (2016). The ethics of algorithms: Mapping the debate. Big Data & Society, page 4 So what? Three things nonprofit decision makers can do (at least)
Any questions or input? Let´s keep in touch! We wish you a smooth start in a hopefully pleasant and successful fall of 2021. All the best! Johannes  For the last decades, lots of efforts have been put in developing machine learning algorithms and methods. Those methods are currently being widely used among companies and let us extract meaningful insights from our raw data to solve complex problems that could hardly be solved otherwise. They make our life (and our job) easier, but at what cost? There is a good reason why Machine learning methods are known as being “black-box”: They have turned so complex that is hard to know what is exactly going on inside them. However, understanding how models work and making sure our predictions make any sense is an important issue in any business environment. We need to trust our model and our predictions in order to apply them for business decisions. Understanding the model also help us debug it, potentially detect bias, data leakage and wrong behaviour. Towards interpretability: The importance of knowing our data We should take into account that, whenever we talk about modelling, there needs to be a lot of work behind related to data preparation and understanding. Starting with the clients’ needs or interest, those need to be translated into a proper business question, upon which we will then design an experiment. That design should specify, not just the desired output and the proper model to use for it, but also – and more important – the data needed for it. That data needs to exist, be queried and have enough quality to be used. Of course, data also needs to be explored and useful variables (i.e. variables related to the output of interest) be selected. In other words: Modelling is not an isolated process and its results cannot be understood without first understanding the data that has been used to get those results, as well as its relationship with the predicted outcome. 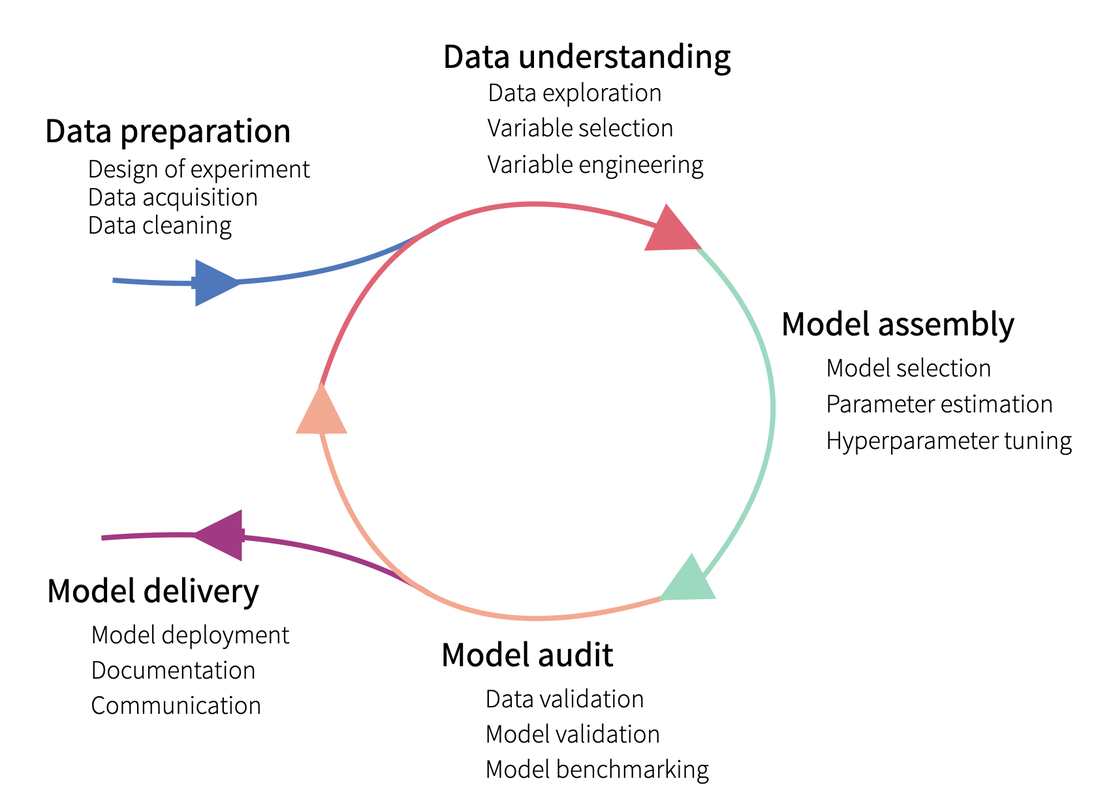 Interpretable vs. non interpretable models Until now, we have just talked about black-box models. But are actually all models hard to interpret? The answer is no. Some models are simpler and intrinsically interpretable, including linear models and decision trees. But since that decrease in complexity comes with a cost on the performance, we usually tend to use more complex models, which are hardly interpretable. Or are they? Actually, intensive research has been put into developing model interpretability methods and two main type of methods exist:
Those model methods can also be grouped, depending on their predictions scope, into:
Some Global interpretability examples As previously mentioned, probably the most widely method used is the calculation of the feature importance, and many packages have their own functions to calculate it. For instance, package caret has the function varImp(), which we have used to plot the following example. There, we can see how feature “gender-male” and “age” seem to be the most important features to predict the survival probability in the titanic (yes! we have used the famous Kaggle titanic-dataset to build our models).  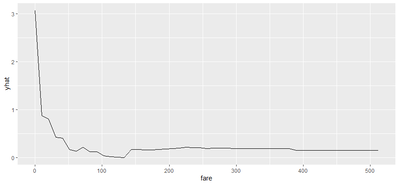 Partial dependence plots are also widely used. These plots show how predicted output changes when we change the values on a given predictor variable. In other words, it shows the effect of single features on the predicted outcome, controlling for the values of all other features. In order to build them, function partial() from package pdp can be used. For instance, in the following partial depende plot we can see how paying a low fare seems to have a positive effect on the survival – which makes sense, knowing for instance that children had preference on the boats! Some local interpretability examples Local interpretability techniques can be studied with the packages DALEX and modelStudio, which let us use a very nice and interactive dashboard – where we can choose which methods and which observations are we most interested at. 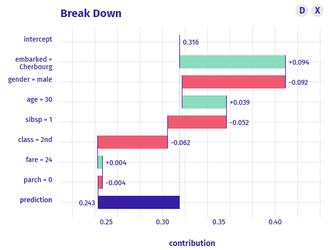 One of the best methods contained are the so-called break-down plots, which show how the contributions attributed to individual explanatory variables change the mean model prediction to yield the actual prediction for a particular single observation. In the following example of a 30 year old male travelling on 2nd class, which payed 24 pounds and boarded in Cherbourg, we can see how the boarding port and the age had a positive contribution on the survival prediction, whereas his gender and the class had a negative one. In this way, we can study each of the observations which we want or have to focus on – for instance, if we think that the model is not working properly on them. Shap values is a similar method, which consists on taking each feature and testing the accuracy of every combination of the rest of features, checking then how adding that feature on each combination improves the accuracy of the prediction. On the following example, and for the same observation as we just analysed, we can see that result are very similar: gender shows the biggest and most negative contribution, while the boarding port has the biggest and most positive effect on the survival prediction, for that specific passenger. 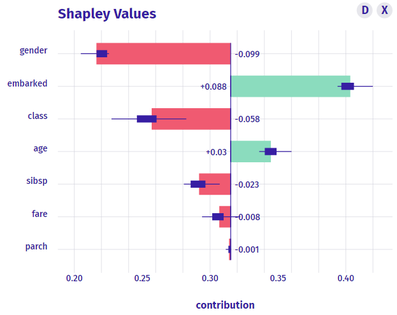 Last, if we are interested on how observations’ predictions change when changing feature values, we can study the individual conditional expectation plots. Even though they can just display one feature at a time, it let us have a feeling on how predictions change when feature values change. For instance, on the following example we can see how increasing the age have a negative effect on the survival of the titanic passengers. 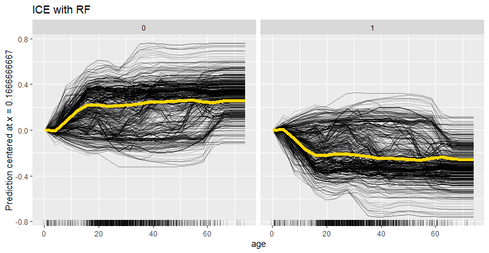 Some last words
In this post, we have made a brief introduction on the interpretability of machine learning models, we have explained why is important to actually be able to interpret our results and we have shown some of the most used methods. But just as a reminder: for a similar performance, we should actually always prefer simpler models which are interpretable per se, over super complex machine learning ones!
Cognitive biases are systematic patterns of deviation from rationality in judgment. These biases are subject to research interests in fields like psychology and behavioral economics. What we call cognitive biases are mechanisms that have developed within an evolutionary process. They already helped our ancestors in making fast decisions when needed and with limited information processing capabilities. These biases are not only an essential building block of our "gut feeling" but also our intuition to a ceratin degree. This is what Daniel Kahnemann, nobel prize winner for economics in 2002, has called System 1, the area of unconscious and fast decision making in our minds. The speed and ease of this sytem comes with a price as biases can lead to irrational and counter-factual decisons. Biases can affect human power of judgment in a professional context and in personal life. Presumably rational and fact-oriented people like analysts and data scientists are not save from cognitive biases either. Some authors even argue that they are even more prone to be to biased due to the experimental and research-oriented nature of their work. As biases are essentially part of human nature and they are everywhere, it is important to be aware of them. This might enable us to give better advice to others and take more informed decisions ourselves. We will try to provide a light introdcution, some hints for prevention and some interesting sources for further reading. Let us look at the most relevant cognitive biases one by one.
So what?You can get it if you really want. But you must try, try and try. Jimmy Cliff, You can get if you really want. Overcoming cognitive biases completely might be almost impossible. However, raised awareness of how our minds try to trick us will already lead to noticeable improvements in judgment. If you are interested in the topic, we can recommend the following readings. Books
Blog Posts
|


Week |
Day |
Type |
Content & Link |
1 |
Monday |
📝 Blog |
Daydreaming Numbers: bit.ly/2S928qS |
1 |
Tuesday |
🎬 Video |
TED Talk by David McCandless: bit.ly/2HFgBZy |
1 |
Wednesday |
📝 Blog |
Visual Capitalist: bit.ly/3kU0gON |
1 |
Thursday |
📰 Article |
HBR: A Data Scientist´s real job: bit.ly/3jcEbL6 |
1 |
Friday |
🎬 Video |
TED Talk by Hans Rosling: bit.ly/30fz19v |
2 |
Monday |
📰 Article |
Narrative Visualization: stanford.io/2HFEK27 |
2 |
Tuesday |
📝 Blog |
Make it conversationsl: bit.ly/3cIsuJx |
2 |
Wednesday |
🎬 Video |
TED Talk by Tommy McCall: bit.ly/3cC0tn5 |
2 |
Thursday |
🎨 Gallery |
Collection of infographics: bit.ly/3kZt4p5 |
2 |
Friday |
💻 PPT |
Berkeley: Data Journalism: bit.ly/30j7Z1g |
3 |
Monday |
🎬 Video |
Data Storytelling: bit.ly/33arivv |
3 |
Tuesday |
📝 Blog |
Impact on Audience: bit.ly/338dIbQ |
3 |
Wednesday |
🎨 Gallery |
Juice Analytics Gallery: bit.ly/2G6nL8I |
3 |
Thursday |
📕 Book |
Data Journalism Handbook: bit.ly/2S94Hcd |
3 |
Friday |
🎬 Video |
TED Talk by Aaron Koblin: bit.ly/2EFZWDY |
4 |
Monday |
🎨 Gallery |
DataViz Catalogue: bit.ly/34mdy0b |
4 |
Tuesday |
📝 Blog |
Data Visualization Checklist: bit.ly/3cQ0d45 |
4 |
Wednesday |
🎬 Video |
TED Talk by Chris Jordan: bit.ly/3kTaaQT |
4 |
Thursday |
📝 Blog |
Toolbox for Data Storytelling: bit.ly/3mZrd5H |
4 |
Friday |
🎬 Video |
Storytelling with Data: bit.ly/3jd2W9Q |